Your Live Lean Rx Houston DEXA Scan Report provides important information about your body composition and potential health risks. Read more to learn how to understand your report.
The body composition section of your report gives you the most popular information. This section provides your total body fat percentage and your body weight (Total Mass) and breaks down your body weight into each of its components, fat, lean (or muscle) tissue, and bone (or Bone Mineral Content (BMC)). The report also shows your fat free mass, which is how much your body would weigh if you had no body fat. Your report shows this data for each scan done at our office in both in a table format and in graphs so you can see how your body is changing over time.
The Regional Body Composition Analysis section of your report gives you the same breakdown of information for each region of your body. The regions include your arms, legs, trunk, android (waist), and gynoid (hip) areas.
 Loading...
Most of the fat in our bodies is subcutaneous fat stored under the skin. Visceral fat, or visceral adipose tissue (VAT), is a type of fat stored inside the abdominal wall. This fat coats the abdominal organs and can increase your risk of serious health issues and disease. Your report shows the mass of your visceral fat in pounds and the volume measured in cubic inches. You can monitor your risk for visceral fat-related health issues by comparing your visceral fat volume to the scale on the report. This data is tracked at each scan so you can monitor your visceral fat gain or loss as you work towards your goals.
Your android/gynoid (A/G) ratio, also called the waist-to-hip ratio, is another way to monitor for risk of potential health issues. Android fat refers to the waist region of your body while gynoid fat is found in the hip region, including the upper thighs and buttocks. It is common for men to carry more body fat in the waist than in the hips and for women to carry more in the hips than in the waist. Regardless of sex, the ideal A/G ratio should be less than 1.0.
Loading...
DEXA technology was originally developed to measure bone density. Technology advances have made DEXA the gold standard for measuring body composition in addition to screening for bone health. Your DEXA scan report compares your bone density to others of your age, sex, and ethnicity to determine your risk of bone disease. The blue region is considered the normal range for bone density. For more information about bone density screening, bone health concerns, or a below average score, we recommend following up with your medical care provider.
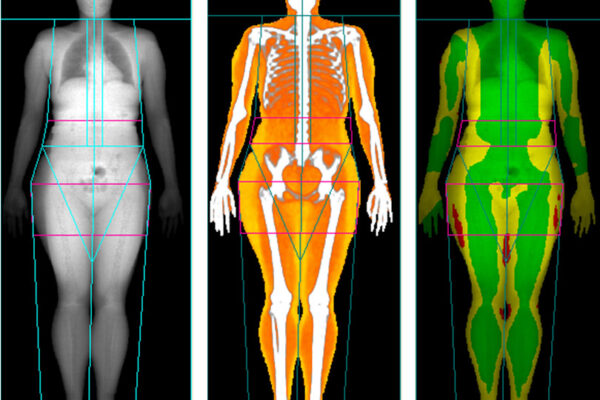
Your report also includes images from your scan. The image on the left shows your bones and soft tissues as an x-ray. The image on the right shows your skeleton in white, your muscle in orange, and your body fat in yellow.
Loading...
While we all have some asymmetry. For example, most people have up to ½ a pound more muscle in their dominant arm than in their non-dominant arm. However, muscle symmetry is an important part of minimizing your risk of injuries. Asymmetry can create changes in posture, gait, and lifting technique that can lead you prone to injury (which can lead you to even more significant asymmetry!). Your DEXA scan report includes a comparison of your right and left arms as well as your right and left legs. Your comparisons are shows for each scan we perform for you so you can compare your changes over time. We recommend you work with a personal trainer or physical therapist to address muscle asymmetry and balance the muscles across your body.
Loading...
The last page of your DEXA scan report shows your DEXA image and summarizes your metrics. Your report will add a side by side image and a new summary each time you return for a DEXA scan so you can visually see the progress you’ve made in your body composition.
Loading...


Recent Comments